

“`json
“`
You upload the exact same video. It gets 100,000 views. Your friend uploads an identical video. Also 100,000 views. But you earn $8,000 while your friend makes $2,400. Same content. Same platform. Same view count. The difference? Your audience geography.
This is the reality of YouTube earnings in 2026. And it’s a reality that catches most creators off guard.
YouTube’s CPM (Cost Per Mille—earnings per 1,000 impressions) isn’t determined by YouTube alone. It’s determined by advertisers. And advertisers are willing to pay vastly different amounts depending on where your viewers live. A pharmaceutical company selling to Americans will outbid a company selling to viewers in Southeast Asia. Media companies in Australia pay more per impression than those in Morocco. It’s not fair. It’s not equal. But it’s how digital advertising works.
If you’re building an audience, comparing your earnings to other creators, or trying to optimize your income, you need to understand this. Because the creators winning in 2026 aren’t just getting more views. They’re getting views from the right places.
This guide breaks down exactly how YouTube CPM varies by country in 2026, why it changes despite identical views, and how to evaluate your own earnings based on your audience mix.
What is YouTube CPM and How Does It Differ by Country?
CPM stands for Cost Per Mille. It’s how much advertisers pay YouTube (and you share) per 1,000 ad impressions on your video. If your video generates 10,000 impressions and you earn a $10 CPM, you make $100 before YouTube takes its 45% cut.
But here’s the critical part: CPM isn’t fixed. It changes based on who’s watching.
Advertisers set budgets and bid for placements based on audience demographics, location, and behavior. When an advertiser wants to reach American business professionals, they’ll bid $15-40 per 1,000 impressions. When they want to reach viewers in developing nations, they might bid $0.50-2.00 per 1,000 impressions. YouTube’s algorithm matches the highest bidder to your inventory, so your actual CPM is a weighted average of all the bids for your viewers’ impressions.
In 2026, this geographical disparity is more pronounced than ever. Here’s why:
Economic purchasing power: Advertisers optimize for conversion. A $100 product sold to a US viewer generates more profit margin than the same product sold to a viewer earning $200/month in a developing nation. So they pay more for US-based impressions.
Ad competition: Some countries have more advertisers competing for attention. More competition = higher bids. The United States, United Kingdom, Canada, and Australia have massive advertiser markets. Smaller nations have fewer advertisers, so fewer competing bids drive CPM down.
Currency strength: Strong currencies mean stronger purchasing power. Viewers in Switzerland, Norway, and Denmark command premium CPM rates because the currency is strong and purchasing power is high.
Content monetization policies: Some countries have stricter ad policies. This limits advertiser access and lowers CPM. Other countries have fewer restrictions, attracting more bidders.
Niche and industry: Finance, technology, and business content attracts higher-paying advertisers. Creators in these niches with US/UK audiences can see CPM rates of $20-50+. Gaming or lifestyle content might be $3-8 in the same countries.
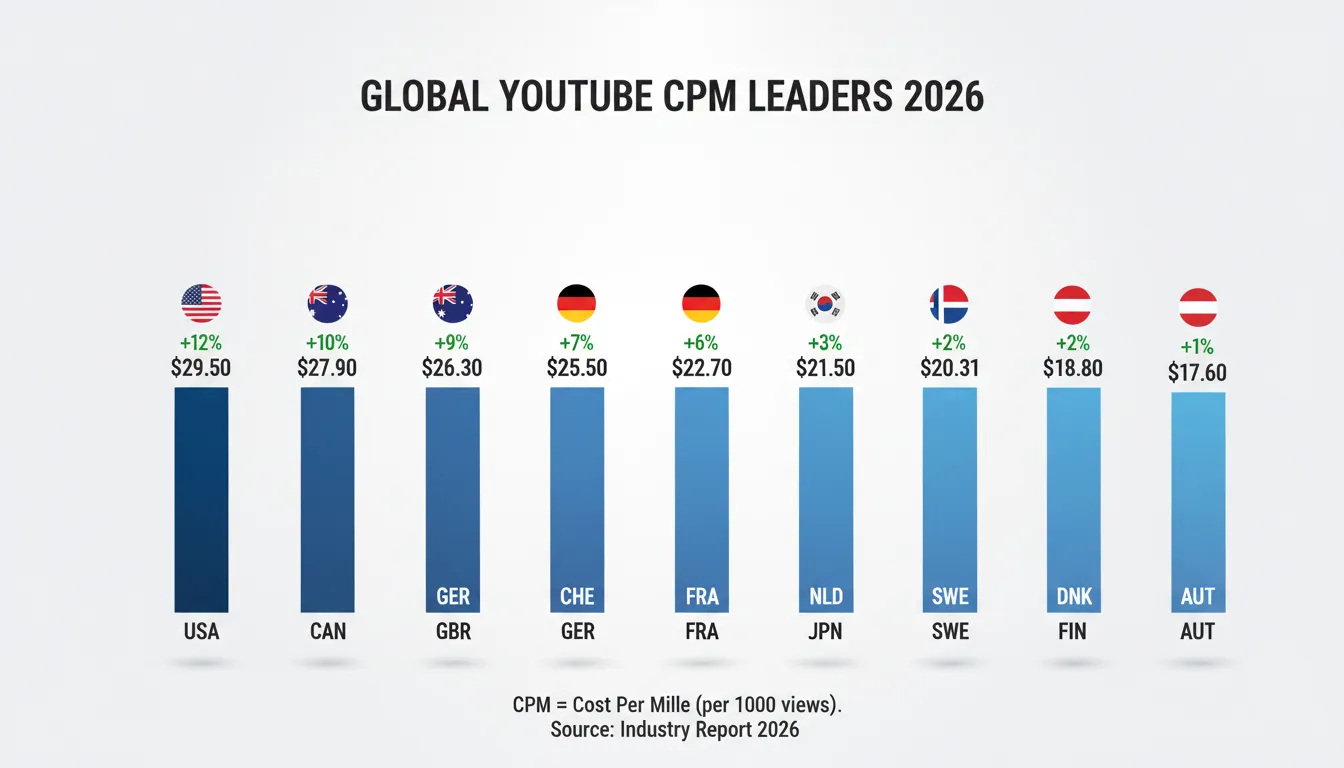
YouTube CPM by Country in 2026: The Complete Rankings
Understanding where your viewers come from is impossible without data. Here’s the breakdown of estimated CPM rates by country for 2026:
Tier 1: Premium Markets ($8-40+ CPM)
These countries have strong economies, high advertiser competition, and viewers with strong purchasing power.
| Country | Estimated CPM Range | Key Factors |
|———|——————-|————|
| United States | $15-45 | Largest advertiser market, premium content niches, highest competition |
| Switzerland | $18-50 | Strongest currency, high purchasing power, affluent audience |
| Australia | $12-35 | Strong economy, English-speaking, premium advertisers |
| Norway | $14-38 | High income per capita, strong currency, premium market |
| Canada | $12-32 | Second-largest English market, strong advertiser base |
| United Kingdom | $11-28 | Major advertiser hub, established media market |
| Denmark | $13-36 | Nordic premium market, strong currency |
| Netherlands | $10-26 | Developed economy, high purchasing power |
| Germany | $9-24 | Largest European economy, strong advertiser market |
| Sweden | $12-32 | Nordic premium market, affluent viewers |
| New Zealand | $10-28 | English-speaking, developed economy |
| Belgium | $9-22 | Developed European market |
| Luxembourg | $11-30 | Highest GDP per capita in Europe |
| Ireland | $10-25 | English-speaking, tech hub, premium advertisers |
| Austria | $8-20 | Developed European economy |
Tier 2: Secondary Markets ($3-12 CPM)
Developing economies with moderate advertiser competition. Still respectable earnings but significantly lower than Tier 1.
| Country | Estimated CPM Range | Key Factors |
|———|——————-|————|
| France | $6-18 | Large market but competitive local content |
| Spain | $5-15 | Developed European economy |
| Italy | $5-14 | Developed European economy |
| South Korea | $5-14 | Developed tech market, local content preference |
| Japan | $6-16 | Developed economy, strong local advertisers |
| Singapore | $5-14 | Developed economy, affluent audience |
| United Arab Emirates | $4-12 | Growing market, regional advertisers |
| Brazil | $2-8 | Large population but lower purchasing power |
| Mexico | $2-8 | Large Spanish-speaking market, lower CPM |
| Poland | $2-7 | Eastern European market, growing |
| Russia | $1-5 | Limited advertiser access, sanctions impact |
| Turkey | $1-5 | Emerging market, currency depreciation |
| Thailand | $1-4 | Emerging market, lower purchasing power |
| Malaysia | $1-4 | Developing Southeast Asian market |
| Vietnam | $0.80-3 | Growing but still developing market |
Tier 3: Emerging Markets ($0.50-3 CPM)
Developing nations with smaller advertiser markets and lower purchasing power.
| Country | Estimated CPM Range | Key Factors |
|———|——————-|————|
| Philippines | $0.50-2.50 | Large population, lower purchasing power |
| Indonesia | $0.50-2.50 | Largest Southeast Asian market, growing |
| India | $0.50-3.00 | Massive population, extremely low purchasing power |
| Nigeria | $0.30-1.50 | Emerging African market |
| Pakistan | $0.30-1.50 | Large population, developing economy |
| Bangladesh | $0.30-1.50 | Developing South Asian market |
| Egypt | $0.30-1.50 | Growing Middle Eastern market |
| Kenya | $0.30-1.50 | Emerging East African market |
| Colombia | $1-3 | Latin American market |
| Argentina | $1-3 | South American economy |
| Ukraine | $0.50-2 | War impact, limited advertisers |
| Romania | $0.70-2.50 | Eastern European market |
| Greece | $1-3 | Southern European economy |
What This Means In Practice:
If you have 100,000 views:
– From the United States: $1,500-4,500 gross earnings
– From Switzerland: $1,800-5,000 gross earnings
– From India: $50-300 gross earnings
– From Philippines: $50-250 gross earnings
Same view count. Dramatically different revenue.

Why CPM Fluctuates: The Real Factors Behind Earnings Variability
Your CPM isn’t fixed. It fluctuates constantly based on market conditions, seasonality, and competition. Understanding these variables helps you understand why your earnings change week-to-week, even if your view count stays consistent.
Seasonal Demand Cycles
CPM rates spike during certain times of year. Q4 (October-December) typically sees the highest CPM rates because businesses increase advertising budgets for holiday shopping season. January sees a spike as New Year’s resolution-related businesses advertise fitness, education, and self-improvement. Summer vacation months see reduced CPM as many businesses reduce ad spending.
In 2026, expect these seasonal patterns:
– October-December: CPM rates 20-40% higher than annual average
– January-February: CPM rates 10-15% higher (New Year marketing)
– July-August: CPM rates 15-25% lower (summer slowdown)
– September: CPM rates recovering as back-to-school campaigns launch
Industry-Specific Demand Fluctuations
Different industries have different advertising calendars. Finance and investment content sees higher CPM from January through March (tax season, new investment plans). E-commerce and shopping content peaks Q4. Health and fitness content peaks January and September. B2B technology content remains consistent year-round.
If your content straddles multiple niches, your CPM can swing 30-50% based on which industry is currently bidding most aggressively.
Advertiser Budget Exhaustion
Major advertisers have monthly and yearly budgets. Early in the month, advertisers bid aggressively because they have fresh budgets. By month-end, budgets are depleted and competition decreases. This can create a 10-20% variance in CPM between the 1st and 31st of each month.
Competition Among Creators
More creators in your niche means more inventory (ad placements). More inventory can suppress CPM slightly because advertisers have more options. If 100 channels are competing for the same advertisers, CPM might be lower than if only 10 channels existed.
Viewer Engagement Metrics
Viewers who watch longer, click on ads, and engage with content are worth more. If your audience has high engagement, YouTube shows your inventory to advertisers as “premium” and CPM increases. Low engagement signals the opposite.
Ad Quality and Content Relevance
YouTube’s algorithm matches ads to content. A video about financial planning gets matched with high-paying finance ads. A video with vague, general content gets matched with lower-paying ads. More specific, niche content typically has higher CPM.
Key Takeaways
CPM vs RPM: Understanding the Critical Difference
Here’s where most creators get confused. You’ll hear two terms: CPM and RPM. They sound the same. They’re not.
CPM = Cost Per Mille (what advertisers pay)
– This is the gross rate advertisers pay to YouTube per 1,000 impressions
– You don’t keep all of this. YouTube takes 45%, you keep 55%
– Ranges from $0.30-50+ depending on country and niche
RPM = Revenue Per Mille (what you keep)
– This is what you actually earn after YouTube’s cut
– This is also affected by how many impressions generate clicks vs views
– This is the number that matters for your income
– Roughly 55% of CPM, but can vary based on click-through rates
The Math:
– CPM: $20 per 1,000 impressions
– YouTube’s cut: 45% = $9
– Your RPM: 55% = $11
So when you see CPM rates quoted, remember you’re keeping roughly 55% of that. (Some sources quote different splits, but 45/55 is standard in 2026.)
Why This Matters for Your Strategy:
If you’re comparing your earnings to another creator, they might be quoting CPM while you’re quoting RPM. A creator saying “My CPM is $25” is actually earning $13.75 RPM. Another creator saying “My RPM is $12” is generating roughly $22 CPM. You’re nearly at parity, but the terminology made them sound different.
Always ask: Are you talking about CPM (what advertisers pay) or RPM (what you actually earn)?

The Viewer Geo-Mix: Why Your Audience Location is Everything
Your CPM is ultimately determined by one factor: where your viewers live.
Two channels with identical view counts, identical niches, and identical content can earn 3x-10x different amounts based solely on viewer geography. This is the geo-mix.
What is Geo-Mix?
Geo-mix is the breakdown of where your viewers are geographically. If 50% of your viewers are from the US and 50% are from India, your geo-mix is 50/50. If 80% are from Australia and 20% are from Nigeria, that’s your geo-mix.
Your geo-mix directly determines your average CPM through a weighted calculation:
Average CPM = (US Viewers × US CPM) + (AU Viewers × AU CPM) + (IN Viewers × IN CPM) etc.
Example:
– 40% of your viewers are from the United States (CPM: $25)
– 30% are from Canada (CPM: $20)
– 20% are from Australia (CPM: $18)
– 10% are from India (CPM: $1.50)
Your blended CPM = (0.40 × $25) + (0.30 × $20) + (0.20 × $18) + (0.10 × $1.50) = $10 + $6 + $3.60 + $0.15 = $19.75 CPM
Now imagine the exact same channel, but with different geo-mix:
– 70% from India (CPM: $1.50)
– 15% from Pakistan (CPM: $1.20)
– 10% from Nigeria (CPM: $0.80)
– 5% from United States (CPM: $25)
New blended CPM = (0.70 × $1.50) + (0.15 × $1.20) + (0.10 × $0.80) + (0.05 × $25) = $1.05 + $0.18 + $0.08 + $1.25 = $2.56 CPM
Same channel. Same content. Same algorithm. Different geo-mix = 7.7x difference in CPM.
This is why two creators with seemingly identical channels earn wildly different amounts.
How Geo-Mix Changes Over Time:
Your geo-mix isn’t static. It changes as:
– Your content spreads to different regions
– Algorithm recommends your content differently
– Viral moments bring unexpected viewers from new countries
– You optimize content for certain audiences
– Seasonal trends change viewing patterns by region
A channel that starts with 80% US viewers might shift to 60% after going viral in India. That’s a massive earnings hit, even if total view count increases.
How to Optimize Your Geo-Mix:
1. Check YouTube Studio Analytics: See exactly where your viewers are coming from. Most creators ignore this data.
2. Create for High-CPM Countries: If you see 10% of viewers from Australia but 60% from India, you could shift content strategy to appeal more to Australian audiences. Harder? Yes. But potentially 18x the earnings per view.
3. Target Premium Niches in Premium Countries: Finance, business, technology content from creators in the US/UK/AU commands premium CPM. Gaming and entertainment command lower CPM.
4. Use Thumbnails and Titles for Geo-Targeting:
Advertisement