
The New Zealand creator economy is at an inflection point. While the country’s population sits at just 5.2 million, YouTube creators here benefit from something most small markets don’t have: a Tier 1 English-speaking audience with premium advertising rates. In 2026, New Zealand creators are earning significantly more per thousand views than creators in larger but lower-CPM countries. The question isn’t whether you can make money on YouTube in NZ—it’s whether you’re optimizing for maximum earnings.
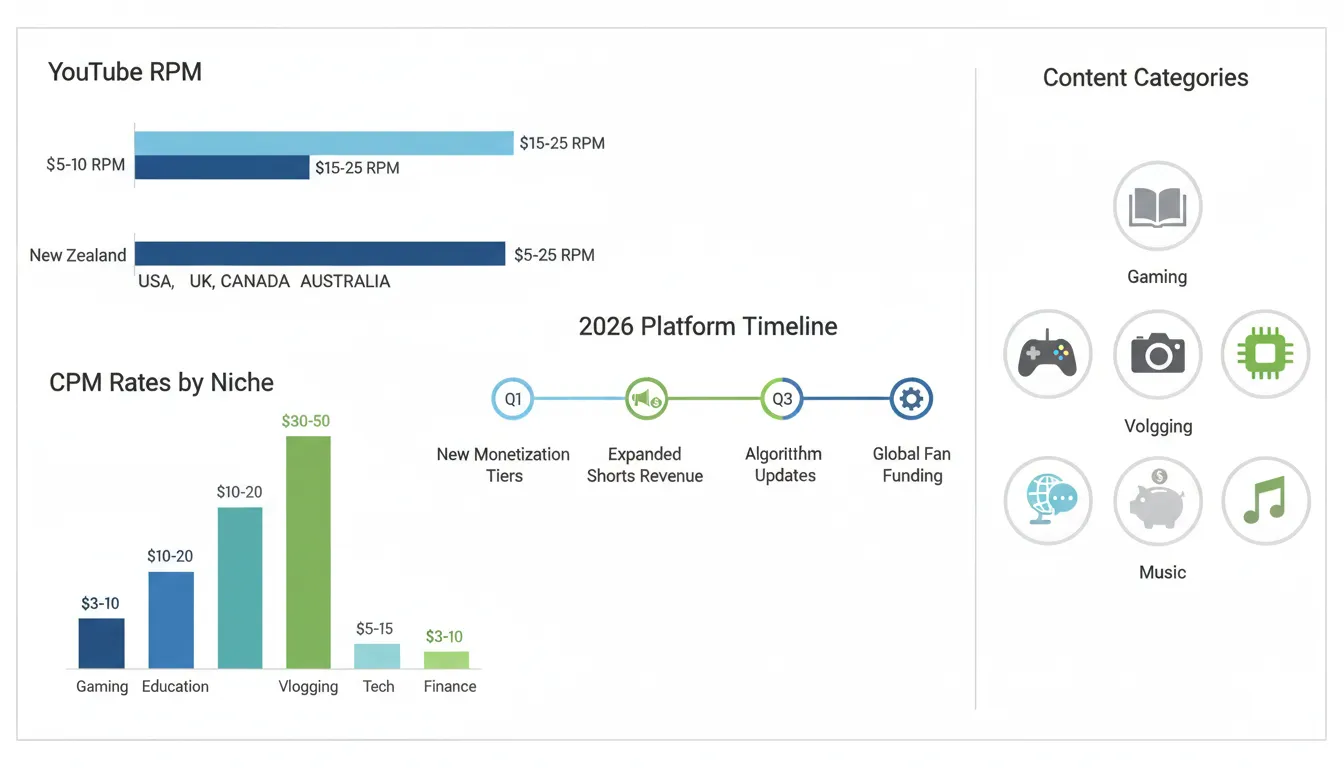
Here’s the reality that most NZ creators miss: a video that generates 100,000 views in New Zealand might earn considerably more than the same traffic from India, Southeast Asia, or Latin America. This isn’t luck. It’s driven by three fundamental factors: viewer purchasing power, advertiser demand, and content niche. The average New Zealand YouTube RPM in 2026 ranges from $8 to $25 depending on content category, but premium niches like finance, property, and business education consistently exceed $30 RPM. See our guide on how Switzerland compares as Europe’s highest-paying YouTube market.
This guide is built for Oceania creators who want specifics, not platitudes. We’ll break down exactly what you can expect to earn, why NZ RPM differs from global averages, which niches perform best, and the actionable strategies that separate five-figure monthly earners from struggling channels.
What is YouTube RPM and How Does It Differ from CPM?
RPM stands for Revenue Per Mille—that’s revenue per thousand views. CPM stands for Cost Per Mille—the amount advertisers pay per thousand impressions. They sound similar, but they’re fundamentally different, and understanding this distinction changes how you think about earnings.
CPM is what advertisers pay. RPM is what you keep.
When an advertiser runs a campaign, they might pay $15 CPM. But YouTube takes a 45% cut. Payment processors take fees. Ad fraud filters remove invalid traffic. By the time revenue reaches your account, you’re looking at roughly 55% of what the advertiser paid. This is why RPM is always lower than CPM.
In New Zealand’s market, this gap is crucial. The country’s CPM rates are exceptionally high—we’re talking $25 to $60 CPM for premium content in finance and property sectors. That translates to $12 to $30 RPM after YouTube’s cut. Compare this to global averages where creators might see $4 to $12 CPM resulting in $2 to $6 RPM, and suddenly New Zealand doesn’t seem like a small market anymore.
The NZ advantage exists because advertisers know the audience has spending power. A property investment course advertised to New Zealand viewers has a higher conversion rate than the same course advertised to viewers in lower-income markets. Insurance companies, financial services, real estate platforms, and premium consumer goods all bid aggressively for NZ audience access.
However, RPM fluctuates monthly. Seasonal factors, advertiser spend cycles, your upload frequency, audience retention, and even viewer geography within your audience composition affect RPM. June through August typically sees lower rates as businesses reduce ad budgets. November through January surge with holiday retail spending. Understanding these cycles helps you plan income more accurately.
New Zealand YouTube RPM Rates by Niche in 2026
Not all content earns equally. This is the most important principle to grasp. A finance video monetized in New Zealand might earn triple the RPM of a gaming video reaching identical view counts. Niche selection directly determines your earnings ceiling.
Premium High-Earning Niches ($20-$45 RPM):
Finance & Investment Content leads the pack. Tutorials on Kiwisaver, investment strategies, cryptocurrency analysis, and personal wealth building attract affluent viewers and premium advertiser rates. Banks, investment platforms, and financial advisory services compete heavily for placement in this space. Creators covering topics like “how to maximize your KiwiSaver returns” or “best investment brokers in New Zealand” consistently report RPM in the $28-$40 range.
Property & Real Estate runs parallel to finance content. Given New Zealand’s property-obsessed market and high home prices, content about property investment, home renovation, real estate trends, and first-home buyer strategies reaches an audience with significant purchasing power. Property development companies, real estate agencies, mortgage brokers, and home improvement retailers all advertise aggressively here. Expect $22-$38 RPM.
Business & Entrepreneurship consistently performs well. Content targeting business owners, startups, and entrepreneurs attracts accounting software companies, business coaching platforms, and B2B service providers. RPM typically ranges from $18-$32.
Mid-Tier Earning Niches ($10-$20 RPM):
Technology & Gadgets attract advertiser interest but face stiffer competition. Electronics retailers, software companies, and tech service providers advertise here, but the audience is more price-sensitive than finance viewers. Expect $12-$18 RPM depending on how you position content toward premium products.
Education & Self-Improvement performs solidly. Online courses, certification programs, and educational platforms advertise here. RPM sits around $10-$16 for general educational content, though specialized career training content pushes toward $18-$22.
Health & Wellness attracts pharmaceutical companies, health supplement retailers, and wellness service providers. However, strict advertiser policies limit eligible ad partners. RPM typically ranges from $9-$15.
Lower-Earning Niches ($3-$10 RPM):
Gaming & Entertainment unfortunately performs weakly despite high view counts. Most gaming content doesn’t attract premium advertisers, and gaming audiences tend to be younger with lower purchasing power. You’re looking at $4-$9 RPM even with substantial views.
Lifestyle & Vlogs similarly underperform. While views might be high, advertiser demand is modest. RPM averages $3-$8.
Music & Entertainment faces substantial restrictions with music licensing and copyright considerations. When monetizable, RPM sits at $2-$6.
The strategic implication is clear: niches matter enormously. A channel earning 1 million monthly views in gaming ($6 RPM average) generates $6,000 monthly. The same 1 million views in finance content ($30 RPM) generates $30,000. This is why we specifically recommend New Zealand creators build channels around property, finance, and business education—verticals that align with both the market’s strengths and advertiser priorities.

How to Calculate Your Potential New Zealand YouTube Earnings
Calculating your earning potential requires understanding your audience composition. Not all views are equal, especially when your audience spans multiple countries.
The Formula:
Total Monthly RPM Earnings = (Monthly Views × Average RPM) ÷ 1,000
For a channel with 500,000 monthly views and average $15 RPM:
(500,000 × $15) ÷ 1,000 = $7,500 monthly earnings
However, this is simplified. Your actual RPM depends on several variables:
1. Geographic Audience Composition
If 70% of your views come from New Zealand, 15% from Australia, and 15% from other countries, calculate each segment separately:
– NZ views (350,000) × $20 RPM = $7,000
– Australia views (75,000) × $18 RPM = $1,350
– Other views (75,000) × $8 RPM = $600
– Total: $8,950
This is substantially higher than applying a single RPM figure to total views. Geographic audience data is available in YouTube Studio under Analytics > Geographic Performance.
2. Content Seasonality
Track your monthly RPM trends. Most NZ channels show this pattern:
– January-March: $12-$15 RPM (post-holiday decline)
– April-June: $14-$17 RPM (stabilization)
– July-September: $11-$14 RPM (winter business budget cuts)
– October-December: $18-$25 RPM (holiday advertiser spending)
Plan your income based on these fluctuations rather than assuming consistent monthly earnings.
3. Watch Time and Engagement Metrics
YouTube’s algorithm favors videos with high watch time and engagement. Better performing videos attract more premium ads. If your average watch time increases 20%, your RPM might increase 15-25%. Similarly, improved click-through rates and viewer interaction boost advertiser confidence and pricing.
Real-World Calculation for a NZ Finance Channel:
Assumptions:
– 800,000 monthly views
– 65% New Zealand audience
– 20% Australian audience
– 15% other English-speaking countries
– Finance content (premium niche)
Breakdown:
– NZ: 520,000 views × $28 RPM = $14,560
– AU: 160,000 views × $24 RPM = $3,840
– Other: 120,000 views × $12 RPM = $1,440
– Total Monthly: $19,840
This channel would earn approximately $237,000 annually before taxes. This isn’t hypothetical—multiple finance-focused NZ creators report similar or higher figures.
Key Takeaways
Factors That Determine Your Exact RPM in New Zealand
Five variables directly control your RPM. Adjust these, and you’ll see immediate impact on earnings.
1. Content Category and Advertiser Competition
Premium categories command premium rates because advertisers compete aggressively. Finance and property attract bids from well-funded companies with substantial advertising budgets. These companies value conversion and are willing to pay higher CPM to reach affluent, decision-making audiences.
Conversely, entertainment and gaming content attracts smaller advertisers and brands with limited budgets. They’re less willing to pay premium rates because their audiences are less likely to convert to immediate sales.
The solution: If you’re in a lower-RPM niche, consider pivoting toward adjacent premium categories. A gaming channel could evolve into gaming hardware reviews that attract tech retailers and B2B tech companies. A lifestyle channel could specialize in luxury lifestyle products, property tours, or business advice.
2. Audience Demographics and Purchasing Power
YouTube’s advertising system rewards channels with affluent audiences. The algorithm can infer audience wealth through watch history, search behavior, and engagement patterns. If your audience watches finance content, luxury brand reviews, and property content, advertisers classify them as high-income, boosting CPM rates.
New Zealand’s advantage stems from viewer demographics. The country has high disposable income, strong purchasing power, and a culture of investing in property and education. Advertisers recognize this and bid accordingly.
However, not all NZ viewers are equal. A channel attracting 25-55 year-old property investors reaches a more valuable audience than one attracting teenagers. Detailed demographic data is available in YouTube Studio. If you’re targeting younger viewers, you’ll naturally see lower RPM.
The strategic implication: Design content to attract higher-income demographics. Property content naturally attracts 35+ year-old viewers with purchasing power. Finance education attracts both younger ambitious professionals and established business owners. Business tutorials attract entrepreneurs with budgets to invest.
3. Video Watch Time and Audience Retention
Videos with high average view duration attract more premium ads. Here’s why: an advertiser running a 30-second ad prefers it plays before a video someone watches for 15 minutes rather than 30 seconds. The longer watch time represents genuine engagement, not accidental clicks.
Additionally, longer videos can accommodate multiple ad breaks. A 15-minute video might have 2-3 mid-roll ads, while a 5-minute video typically has one. More ads = more revenue.
YouTube Studio shows your average view duration. Aim for 50%+ audience retention. To improve watch time:
– Create longer-form content (12-20 minute videos perform better than 5-10 minute videos in educational niches)
– Hook viewers in the first 15 seconds
– Use pattern interrupts and visual variety to maintain engagement
– Structure content with clear sections and progression
– End with strong calls-to-action that encourage completion
A finance channel experimenting with 8-minute vs. 16-minute content formats might see average watch duration increase from 3 minutes to 8 minutes. This improvement alone could increase RPM by 15-20%.
4. Upload Frequency and Audience Growth Rate
Channels uploading consistently earn more because the algorithm prioritizes consistent creators. Frequent uploads also mean more ad opportunities across your catalog.
New Zealand’s YouTube market is less saturated than major markets, which means consistent creators can build audiences relatively quickly. A channel uploading weekly in finance or property niches can expect to grow 10-20% monthly in the early stages.
Growth rate indirectly affects RPM because rapidly growing channels attract YouTube’s promotion, which brings in fresh, high-value viewers. Additionally, faster growth signals to the algorithm that content is valuable, increasing organic visibility.
Commitment: Establish a upload schedule you can maintain. Weekly is ideal for most niches. Biweekly is acceptable. Monthly is likely too infrequent to build momentum.
5. Seasonal Advertiser Spending Cycles
Advertising budgets aren’t distributed evenly throughout the year. Q4 (October-December) sees massive spending as retailers prepare for the holiday season. January typically sees reduced spending as budgets refresh. Winter months (June-September in the Southern Hemisphere) often see lower spending as businesses reduce promotional activities.
Track your monthly RPM data for a full year to identify patterns. Use this data to plan income and adjust your content calendar. Some creators stockpile content during low-RPM months to release strategically during high-RPM periods, though this approach has limitations since audience expectations for upload frequency affect algorithm performance.

Tools and Resources to Track Your New Zealand YouTube RPM
Understanding your actual RPM requires proper tracking. For a full breakdown of YouTube CPM and RPM rates by country in 2026, our master guide covers 20+ markets. YouTube Studio provides basic data, but several third-party tools offer deeper insights.
YouTube Studio (Free)
YouTube Studio’s Analytics section provides:
– Monthly RPM and estimated revenue
– Geographic performance breakdown
– Watch time and engagement metrics
– Audience demographics
– Traffic source analysis
This data is sufficient for basic tracking. However, it updates with a 48-hour delay and doesn’t provide predictive analysis.
VidIQ (Free and Paid Plans, starting $20/month)
VidIQ offers:
– Real-time earnings predictions
– Competitor channel analysis
– Keyword research specific to your niche
– Trend identification
– Audience insights by geography
For New Zealand creators, VidIQ’s geographic filtering allows you to specifically track NZ audience performance versus other countries.
TubeBuddy (Free and Paid Plans, $9-50/month)
TubeBuddy provides:
– Detailed niche analysis
– Competitor benchmarking
– Keyword optimization
– Revenue tracking
– A/B testing tools for thumbnails and titles
Their analytics dashboard shows average CPM and RPM by niche, helping you benchmark against industry standards.
Google Analytics (Free)
Connecting Google Analytics to your YouTube channel reveals viewer behavior beyond YouTube. You can track:
– Whether YouTube visitors convert on your website
– Traffic patterns and user journey
– Engagement with external links
– Which content drives highest-quality traffic
For creators monetizing beyond YouTube (affiliate marketing, course sales, sponsorships), this data is invaluable.
Cost Breakdown for Creator Tools:
| Tool | Free Tier | Paid Tier | Best For | <br /> |
|---|---|---|---|---|
| YouTube Studio | Full access | N/A | Baseline tracking | |
| VidIQ | Limited analytics | $20-40/month | Trend prediction | |
| TubeBuddy | Basic features | $9-50/month | Competitor analysis | |
| Social Blade | Full access | N/A | Simple RPM tracking | |
| Spreadsheet tracking | Free | Time investment | Custom reporting |
Recommendation: Start with YouTube Studio and free alternatives (Social Blade, basic spreadsheet tracking). As you scale and reach $1,000+ monthly revenue, invest in paid tools like VidIQ or TubeBuddy for competitive advantages.
Advantages and Disadvantages of
Advertisement