

Your YouTube earnings aren’t flat throughout the year. If you’ve noticed dramatic swings in your RPM—sometimes earning $8-12 per thousand views in December and dropping to $2-4 in January—you’re experiencing the seasonal pattern that affects virtually every creator on the platform.
YouTube RPM seasonality is predictable. It follows the advertising dollar cycle. Advertisers have annual budgets. Most of those budgets are spent between October and December when consumers are actively buying gifts, planning vacations, and spending money online. Once January hits, budgets dry up. Ad demand plummets. Your revenue follows.
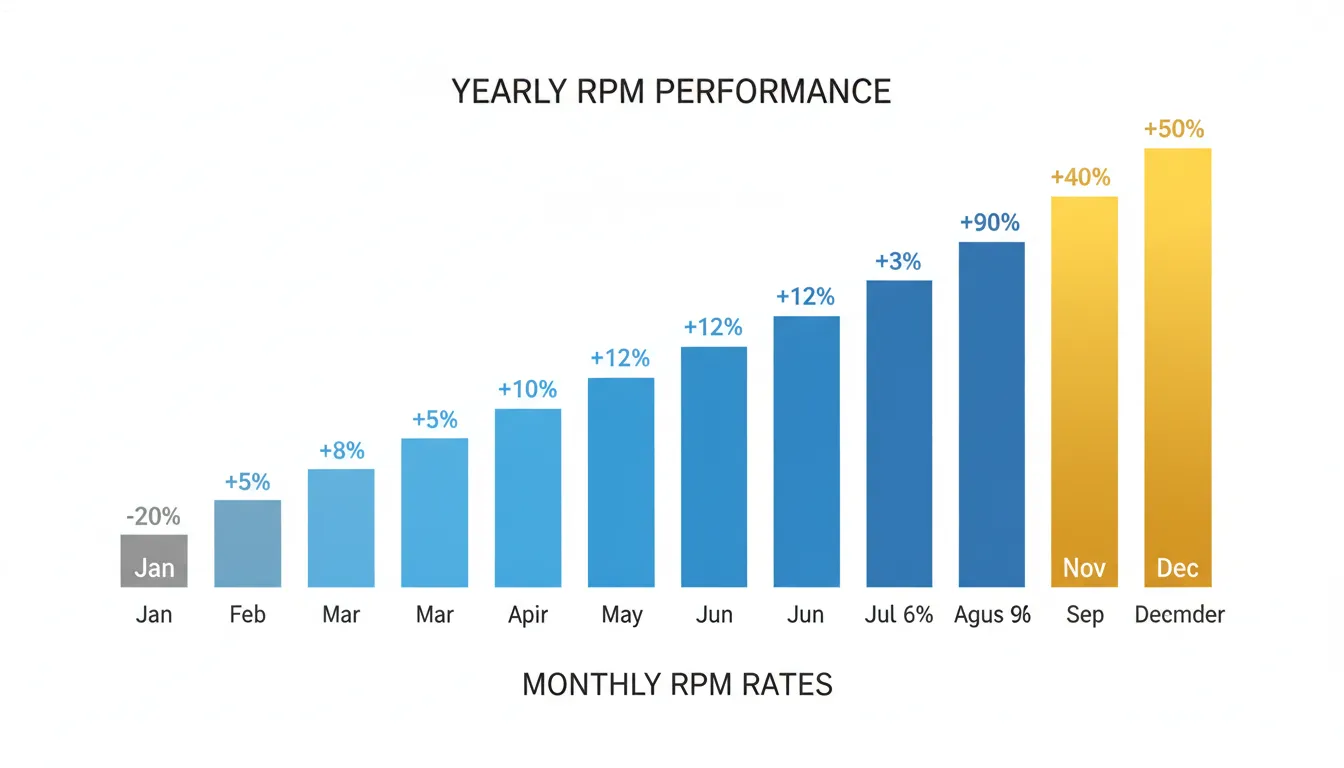
The data is stark. Content creators across niches report Q4 RPM rates that are anywhere from 150% to 300% higher than Q1. Gaming channels see spikes. Finance creators watch their numbers climb. Even niche communities experience the same pattern. This isn’t coincidence. It’s economics.
The crucial part? You can plan for this. You can prepare your content calendar. You can adjust your upload schedule. You can build cash reserves. You can diversify revenue streams. The creators who understand seasonality don’t get blindsided by January’s collapse. They’ve already planned for it.
This article breaks down exactly why YouTube RPM seasonality happens, what to expect month-by-month in 2026, and what you should do right now to protect and maximize your earnings.
Understanding YouTube RPM Seasonality: The Complete Picture
YouTube RPM stands for Revenue Per Mille—earnings for every 1,000 views. It’s different from CPM (Cost Per Mille), which is what advertisers pay. Your RPM is typically 50-60% of the CPM because YouTube takes its cut. When CPM changes, RPM changes directly alongside it.
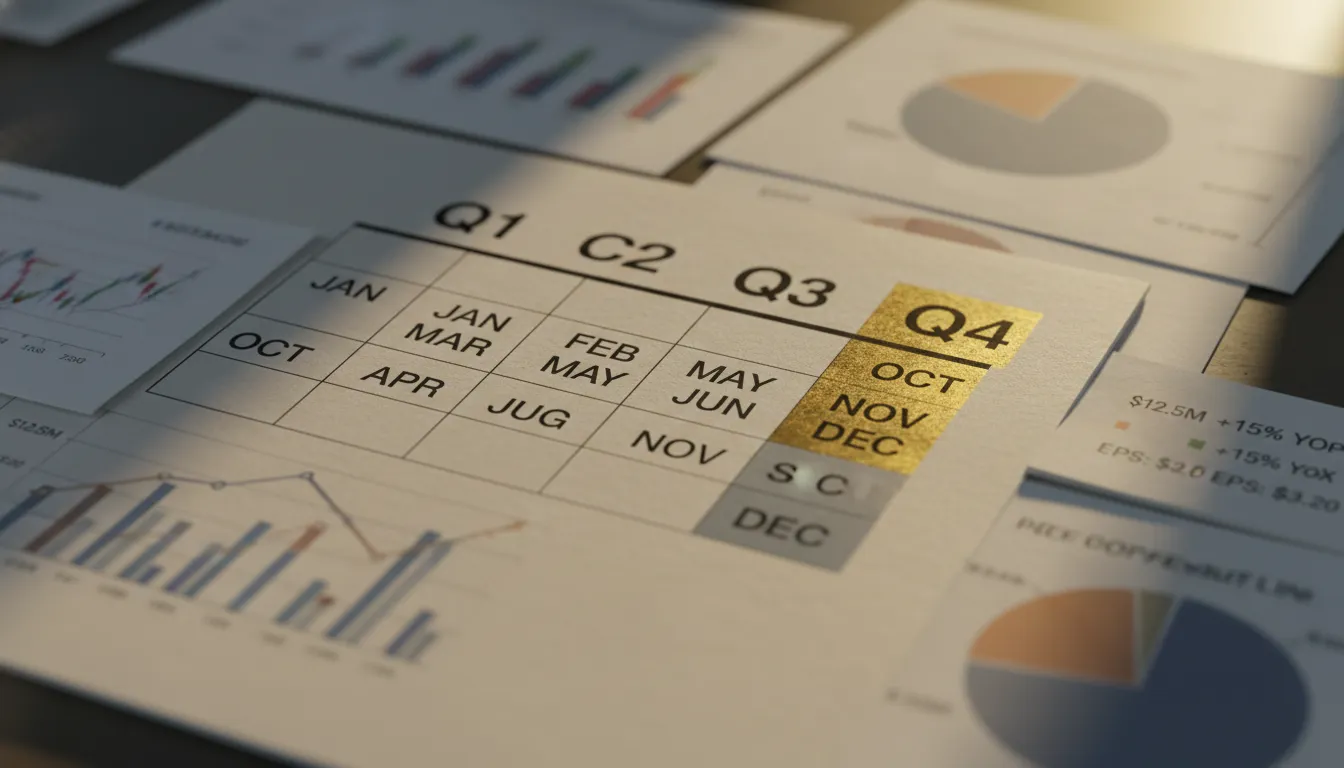
Seasonality refers to predictable patterns that repeat annually. In YouTube’s case, the pattern is brutal for creators. Q4 is boom time. Q1 is bust time. Q2 and Q3 sit somewhere in between, with Q3 slightly stronger as people plan back-to-school content and fall purchases.
Here’s what actually drives this pattern:
Advertiser budgets reset annually. Most companies operate on calendar-year budgets. Marketing budgets are allocated in September and October. Executives want to spend this money before the year ends—often because unspent budgets mean smaller next year. This creates urgency. More urgency equals more ad spend. More ad spend drives CPM up, which lifts RPM.
Consumer spending peaks in Q4. Black Friday, Cyber Monday, Christmas, Hanukkah, Kwanzaa, and New Year’s shopping create the highest consumer spending periods of the year. Advertisers know this. They bid aggressively for ad placement during these months because consumers are actually buying things. When demand from advertisers is high, rates climb.
Holiday content attracts premium advertisers. Q4 content—gift guides, holiday recipes, decoration tutorials, travel planning—attracts luxury and high-ticket advertisers. These aren’t dollar-store products. They’re premium brands willing to pay premium CPM rates. A luxury watch brand pays more per impression than a budget clothing retailer.
January budgets are exhausted. After Q4’s spending spree, January budgets are depleted. Many companies have already hit their annual spend targets. The ones still advertising are smaller brands with smaller budgets. Premium advertisers vanish. CPM plummets. RPM follows.
Back-to-school (August-September) provides a secondary boost. While not as strong as Q4, August and September see elevated spending as retailers prepare for back-to-school season. Students buying supplies, parents buying clothing, teachers preparing classrooms—it drives mid-tier advertising demand.
The seasonality pattern is consistent across platforms and geographies, though the intensity varies. Creators in the United States, Canada, UK, and Australia experience stronger swings than creators in emerging markets because advertisers focus their premium budgets on high-spending countries.
Month-by-Month RPM Expectations for 2026
Understanding the specific pattern for each month helps you plan realistically. Here’s what to expect based on historical patterns and 2026 projections:
January: The Collapse
Expect your lowest RPM of the year. January is when most creators notice the dramatic drop. After a strong December, you’ll see RPM cut in half or worse. Typical range: $2-4 per thousand views depending on your niche and audience geography. Why? Advertisers have exhausted budgets. Consumers are broke after holiday spending. The only exception is fitness and self-improvement content, which sees a minor boost because of New Year’s resolutions.
February: Staying Low
RPM remains depressed. Some slight improvement over January as budgets begin to replenish, but nothing dramatic. Range: $2.50-4.50. Financial content performs slightly better this month as tax season approaches (in the US, tax filing starts mid-January and continues through mid-April).
March: Slight Recovery Begins
You’ll notice a modest uptick. Spring is coming. E-commerce sites begin planning Easter and spring promotional campaigns. Range: $3-5. This month is borderline for many creators—not quite good, not quite terrible. It’s the limbo month.
April: Spring Settling
Spring spending is real but not dramatic. Many advertisers are still conservative. Range: $3.50-5.50. Easter is early April for some years; tax deadlines drive some finance content spikes.
May: Approaching Summer
Summer travel planning drives some uplift. Tourist destinations, travel companies, outdoor equipment brands increase spend. Range: $4-6. Still below the yearly average for most creators, but noticeably better than winter.
June: Summer Begins
School is ending. Families book vacations. Summer content performs well. Range: $4.50-6.50. Vacation, travel, and lifestyle content see the strongest RPM this month.
July: High Summer, Lower Than Expected
Counterintuitively, July is often slightly lower than June because many small businesses and advertisers take summer breaks. People take vacations. Decision-makers are out of office. Range: $4-6. Your RPM might dip compared to June despite producing summer content.
August: Back-to-School Secondary Boost
This is the secondary spike of the year. Back-to-school shopping, college preparation, and educational content drive advertiser demand. Range: $5-7.50. This is notably stronger than May-July. If you create educational content or can tie your content to back-to-school themes, August is your friend.
September: Back-to-School Continues, Budgets Plan Q4
September is still strong. Some advertisers are already planning Q4 campaigns and beginning their spend. Range: $5.50-8. This month marks the transition toward Q4’s stronger season.
October: Q4 Ramp-Up Begins
October is when the money really starts flowing. Holiday season planning kicks into overdrive. Halloween content drives October specifically, but the real driver is Q4 budgets opening up. Range: $6-9. You’ll see a noticeable jump compared to September.
November: Near Peak, Before Holiday Push
November is strong. Black Friday and Cyber Monday are the biggest e-commerce events of the year. Thanksgiving brings travel planning. Thanksgiving-related content and early holiday content perform well. Range: $8-12. This is solid, and for many creators, this month nearly reaches peak earnings.
December: The Peak
December is when you make money. Holiday shopping is at maximum. Gift guides dominate. Luxury brands spend freely. CPM hits the year’s highest levels. Typical range: $10-15+ depending on your niche and audience. Some premium niches (finance, luxury goods, high-ticket items) see $15-20+. Gaming, tech, and lifestyle niches typically see $10-14. Cooking and DIY content see $8-12.
This month-to-month breakdown shows the dramatic variance. A channel might earn $5,000 from 1 million views in January but $15,000 from the same 1 million views in December. That’s a 300% difference.
Why Q4 Dominates: The Economics Behind the Spike
Q4’s dominance isn’t arbitrary. It’s driven by hard economic factors that repeat yearly. Understanding why helps you plan smarter strategies.
The Annual Marketing Budget Cycle
Large advertisers operate on fiscal calendars. Most align with the calendar year. In August and September, marketing teams finalize their annual budgets. They allocate dollars across channels. They prioritize Q4 because Q4 drives business results.
An e-commerce company knows their year’s sales depend on holiday shopping. They might allocate 40% of their annual ad budget to Q4. They’re not being wasteful—they’re following where the customers are. This creates intense competition for ad inventory, driving CPM up dramatically.
Small businesses and mid-market companies operate differently. They have smaller budgets and less sophisticated planning. But they still know Q4 is critical. A local furniture store might spend their entire annual digital budget in October-December because that’s when people buy furniture as gifts or plan their new year renovations.
Consumer Behavior Peaks
Consumers spend more in Q4. Period. Here are the numbers:
– Holiday shopping (Thanksgiving through December 31): Represents 20-25% of annual retail sales
– Online shopping during holidays: 30-35% of annual e-commerce revenue
– Average American household increases spending by 30-50% from baseline in November-December
– Gift purchasing happens almost entirely in Q4
When consumers spend more, they see more ads. When they see more ads, advertisers compete for visibility. Competition drives prices up.
Premium Inventory Scarcity
YouTube has a finite amount of ad inventory. Every video has limited ad slots. During Q4, more advertisers want those slots than there are available slots. Basic supply-and-demand economics apply. When supply is limited and demand is high, prices rise.
This is especially true for premium placements. A skippable ad at the start of a popular video is more valuable in December than in February because more consumers are watching, and advertisers know they’re more likely to convert those viewers into customers.
Category Spending Patterns
Specific advertising categories drive Q4 spending:
| Category | Q4 Typical Spend Increase | Why |
|———-|————————–|—–|
| Retail/E-commerce | +300-400% | Holiday shopping |
| Travel/Hospitality | +200-250% | Holiday travel planning |
| Luxury Goods | +250-350% | Gift-giving season |
| Tech/Electronics | +400-500% | Biggest shopping category |
| Jewelry/Watches | +300-400% | High-value gift items |
| Toys | +500%+ | Peak toy-buying season |
| Fashion/Apparel | +200-300% | Gift-giving + holiday events |
| Home/Garden | +150-200% | Holiday entertaining + New Year’s renovations |
| Financial Services | +50-100% | Tax planning + investment resolutions |
These categories don’t just spend more—they spend on premium placements. A luxury watch brand isn’t buying cheap ad inventory. They’re bidding for prime spots on high-traffic videos. Their spending drives overall CPM up across the platform.
January’s Budget Depletion
Once Q4 ends, the spending stops abruptly. Companies have hit their annual budgets. Particularly large companies with disciplined budget management immediately pull back spend on January 1st. This creates a cliff—not a gradual decline, but a sharp drop.
Additionally, many companies run performance reviews in January. They analyze Q4 results before allocating new budgets. There’s a lag period where decision-makers are reviewing data before committing fresh budget. This lag extends the January slump into February.
Key Takeaways
What to Do Right Now to Prepare for 2026 Seasonality
Knowledge is worthless without action. Here’s exactly what you should do in 2026 to manage seasonality intelligently:
1. Build Cash Reserves During Q4
Start now. If you’re currently in Q4 (October-December), treat those earnings differently than normal earnings. This is not money to spend immediately. This is your buffer fund.
Create a separate savings account. Deposit 50-60% of Q4 earnings into this account. This represents the seasonal boost—earnings that won’t repeat in January. By the time January arrives, you’ll have a cushion that covers the income drop.
Example calculation:
– Normal monthly earnings: $4,000 (February-September average)
– December earnings: $12,000
– Seasonal boost: $8,000
– Amount to save: $4,800-4,900
– January earnings: $1,200
– Plus from savings: $4,800
– Total available January: ~$6,000 instead of $1,200
This approach smooths your cash flow across the entire year.
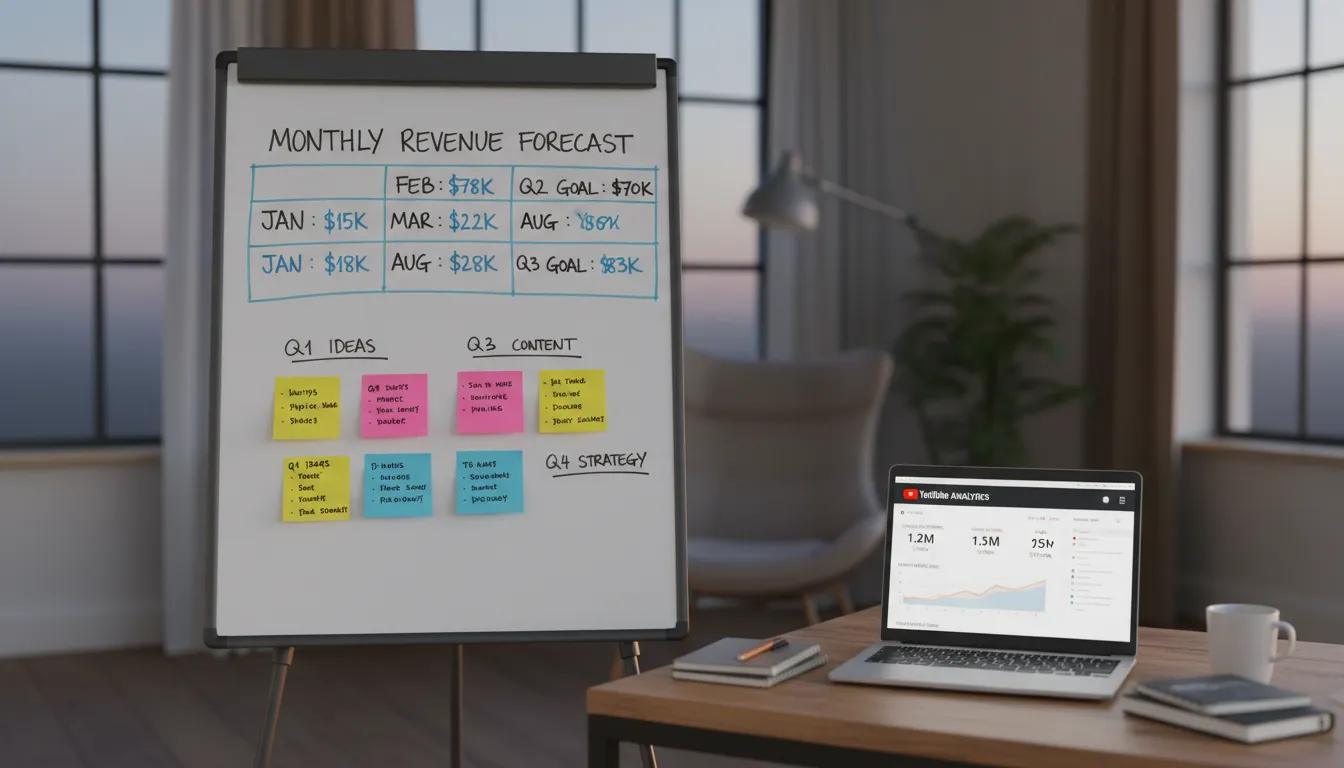
2. Plan Your Content Calendar by Season
Don’t treat all months equally. Create a content calendar that aligns with seasonal demand patterns.
Q4 Strategy (October-December):
– Maximize uploads. You have the highest earnings potential.
– Focus on evergreen content that doesn’t expire quickly. Holiday content is time-sensitive, but gift guides, decoration ideas, and cooking tutorials stay relevant.
– Prioritize high-production-value content. Your earnings are highest, so invest more in quality.
– Create content for premium advertisers. Luxury, tech, and high-ticket items advertise heavily in Q4.
Q1 Strategy (January-March):
– Reduce upload frequency slightly unless you have additional revenue streams. Why burn energy on lower-RPM content?
– Focus on specific niches: New Year’s resolutions (fitness, finance, self-improvement), taxes (finance), and spring preparation.
– Create longer, more valuable content. RPM is lower, but watch time is still valuable for the algorithm. Longer videos with strong engagement can partially offset lower CPM.
– Start building the next season’s content pipeline.
Q2 Strategy (April-June):
– Maintain consistent uploads. RPM is middle-of-the-road, so consistency matters.
– Plan summer content series. Summer content performs better in June-August, so develop ideas now.
– This is planning season. Develop your Q4 strategy while working on Q2 output.
Q3 Strategy (July-September):
– Increase uploads slightly. August’s back-to-school boost is coming.
– Focus on educational and back-to-school aligned content in August.
– Prepare Q4 content heavily. Create gift guides, holiday recipes, decoration tutorials.
– This is your last chance to build inventory before peak season.
3. Diversify Your Revenue Streams
RPM seasonality only hurts if YouTube is your only income. If you have additional revenue sources, January becomes much less painful.
Consider adding:
– Sponsorships: Reach out to brands year-round. Sponsorship deals aren’t seasonal—they’re negotiated directly. A sponsorship worth $500-5,000 per video removes your dependence on AdSense.
– Affiliate Marketing: Promote products related to your niche. Commission percentages are consistent year-round. Affiliate income doesn’t swing seasonally like AdSense.
– Digital Products: Create courses, guides, templates, or tools. Sell them on your website. Digital products generate consistent income regardless of the season.
– Patreon or Membership: Build a subscriber base on Patreon, YouTube Memberships, or other membership platforms. Membership income is recurring and predictable.
– Consulting or Services: Offer your expertise as a service. If you’re a cooking creator, offer personalized meal planning. If you’re a business creator, offer consulting.
The best creators have 40-50% of revenue from AdSense and 50-60% from other sources. This makes seasonality a minor blip instead of a crisis.
4. Negotiate Long-Term Sponsorship Deals in Q3-Q4
Reach out to potential sponsors in September and October. Brands are budgeting for campaigns
Advertisement